Market depth in crypto reveals where liquidity sits across price levels, shaping potential price impact and execution quality. It highlights buy and sell walls, volume clusters, and order-book shape, offering a data-driven view of potential slippage and threshold-based risk. The evidence can also indicate anomalies or manipulation, informing prudent controls and timing. While the implications are clear, practical guidance hinges on consistent monitoring and disciplined application. The stakes and uncertainties invite further scrutiny.
What Market Depth Really Shows in Crypto
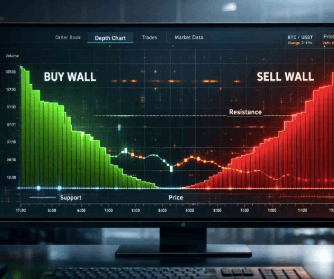
Market depth provides a snapshot of the buy and sell liquidity at various price levels, revealing how much capital is available to absorb trades without moving the price significantly. In crypto, measurements reveal volume clusters and the overall order book shape, highlighting potential resilience or fragility. The data-driven view guides risk-conscious decisions while preserving market freedom and transparency.
How Depth Drives Price Discovery and Slippage
Depth is the engine of price discovery in crypto markets: as buy and sell orders populate different price levels, the distribution of liquidity determines how quickly and at what price a trade is absorbed.
Market depth shapes observable price impact, while order flow reveals absorption pressure, guiding expectations of slippage and execution quality without implying manipulation or certainty.
Reading Depth to Spot Manipulation and Risk
An understanding of how depth is distributed across price levels enables observers to identify anomalies in order books and assess potential manipulation or risk. Reading depth supports assessments of market depth consistency, liquidity pockets, and sudden shifts that may indicate spoofing or sandwich attempts. Such analysis links observed order-flow to price impact, guiding cautious evaluation of exposure and systemic vulnerability.
Practical Ways to Use Market Depth in Trading and Risk Management
Practical use of market depth in trading and risk management rests on translating order-book signals into actionable risk controls and execution decisions. Traders monitor bid-ask ladders to estimate liquidity, timing, and price impact, assigning thresholds for position sizing.
Consider opportunity cost and liquidity fragmentation when reallocating orders, using depth cues to adjust stops, targets, and hedges with disciplined risk parameters.
Frequently Asked Questions
How Does Market Depth Differ Across Crypto Exchanges?
Market depth varies by exchange due to liquidity, order book depth, and listing policies; cross-exchange arbitrage opportunities arise as liquidity mining and market makers influence depth, while exchange fees shape participation and ongoing liquidity across platforms.
Can Depth Data Predict Long-Term Price Trends?
A hypothetical case shows depth data offering limited predictive value for long-term trends; predictive limits emerge as liquidity sourcing fluctuates. While depth spikes may precede short-term moves, sustained forecasts remain uncertain due to market complexity.
What Are the Hidden Liquidity Pools in Depth Analysis?
Hidden liquidity in depth analysis refers to non-visible orders, including phantom orders, that can distort liquidity signals; potential wash trading may accompany them, creating misleading impressions of depth and hidden liquidity, requiring cautious, data-driven interpretation by freedom-seeking analysts.
How Reliable Is Depth During Flash Crashes or Outages?
During a hypothetical 2023 exchange outage, market depth briefly distorts, yet price resilience depends on liquidity fragmentation across venues, underscoring exchange reliability; reliability declines during flash crashes as visible depth narrows and order book gaps widen.
See also: Computer Vision Use Cases
Does Depth Reflect Institutional Versus Retail Trading Activity?
Depth alone does not reliably reveal institutional versus retail activity; signals can be confounded. However, patterns of institutional clustering and retail fragmentation appear in order flow distributions, suggesting partial alignment with activity segments, tempered by exchange design and latency.
Conclusion
Market depth provides a structured snapshot of liquidity distribution, revealing potential execution impact and cost at various price levels. It quantifies slippage risk, informs order sizing, and highlights where liquidity can falter or concentrate. While not a crystal ball, depth data shapes probabilistic outcomes for trades and risk controls. Like a weather map for markets, it forecasts pressure points. Traders should anchor decisions in depth signals alongside velocity, volume, and volatility, avoiding overreliance on singular indicators.